

Morning Star Candlestick Pattern: Easy Guide & Insights
Morning Star Candlestick Pattern: Unlocking Profit Signals in the Stock Market
Introduction
Imagine you're planning a trip and the weather has been stormy for days. Suddenly, the clouds break and you spot the first rays of a new sunrise—hope returns, and you get ready for a brighter day ahead. The stock market has a similar signal called the morning star candlestick pattern. For anyone navigating the ups and downs of trading, this pattern is like a radiant sunrise after a dark night, hinting at potential profits and renewed optimism. Whether you’re new to trading, a seasoned investor, or taking stock market classes, understanding this pattern could be a game-changer for your strategy.
Explore the morning star candlestick pattern, the morning star pattern, and its use in stock market classes. Learn strategy, tips, and expert insights for smarter trading.
What is the Morning Star Candlestick Pattern?
The morning star candlestick pattern is a bullish reversal indicator frequently used in technical analysis. It signals a possible shift from a downtrend to an uptrend, offering traders an early glimpse of potential opportunities.
Anatomy of the Morning Star Pattern
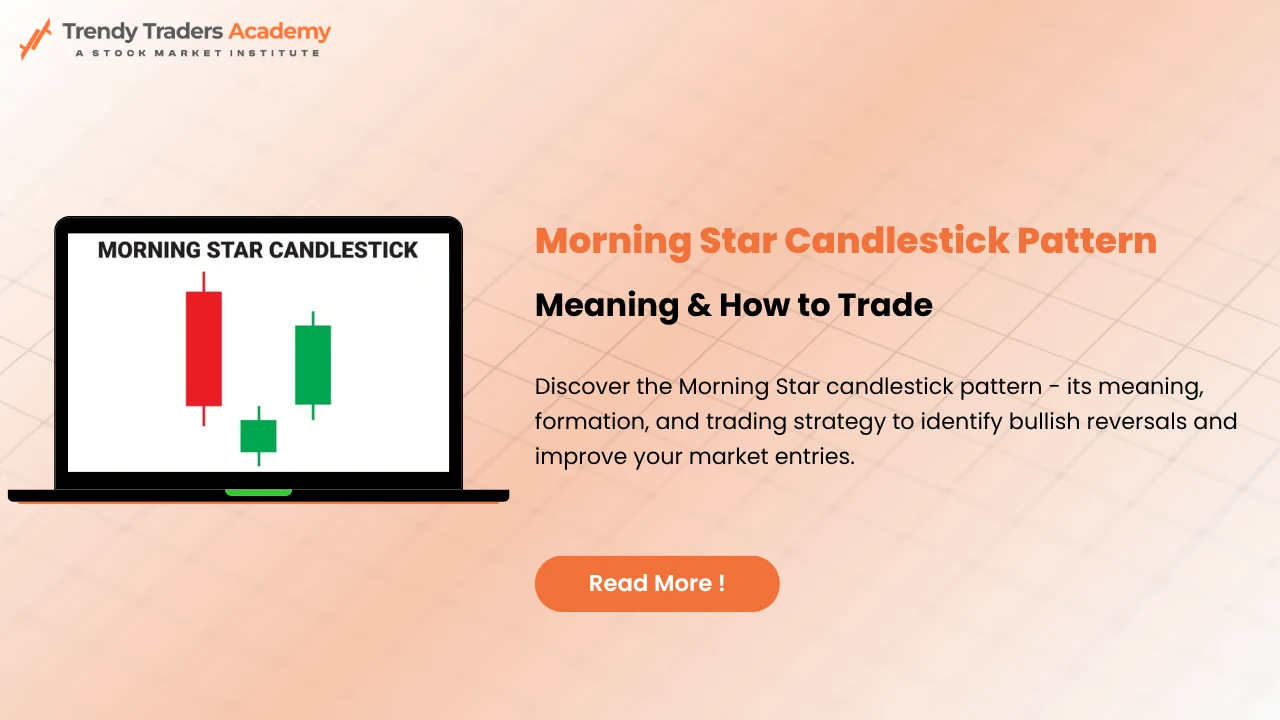
This pattern consists of three candles:
-
First candle (Bearish): Shows strong selling pressure.
-
Second candle (Indecision): Often a small-bodied candlestick, sometimes a doji, reflecting market indecision.
-
Third candle (Bullish): Represents a clear buying surge, closing well above the midpoint of the first candlestick.
Why is It Called the Morning Star?
Just as the morning star signals dawn after nightfall, this pattern marks the possible end of a bearish trend. It’s a metaphorical “light at the end of the tunnel,” reminding traders that even tough market phases have bright beginnings.
Psychological Meaning Behind the Pattern
Think of the morning star pattern as a battle between buyers and sellers. Initially, sellers dominate, pushing prices lower (first candle). Then, with uncertainty in the market (second candle), the sellers begin to lose momentum. Finally, buyers see an opportunity, rush in, and push prices up (third candle), potentially changing the market’s direction.
Key Features and Formation Criteria
To classify as a true morning star candlestick pattern, look for:
-
The first candle is a large bearish candle.
-
The second candle gaps down and has a small real body (could be bullish or bearish).
-
The third candle closes above the midpoint of the first.
-
Appears after a prolonged downtrend.
-
Volume on the third candle is often higher, confirming the reversal.
Step-by-Step: Identifying a Morning Star
Would you like to spot this pattern in real-time? Here’s an easy checklist:
-
Find a downward price trend.
-
Spot the large bearish candlestick (first candle).
-
Look for a small-bodied candle that gaps lower (second candle).
-
Confirm the third candle opens below the second and closes well into the first candle’s real body.
-
Extra points if there’s increased trading volume on the third candle.
Real Chart Examples of Morning Star Patterns
In stock market classes, trainers often use examples from popular stocks like Reliance, TCS, or HDFC. Reviewing historical price charts, you’ll notice that the pattern appears before significant trend reversals. Screeners and charting tools can help scan for this setup quickly.
Morning Star Pattern vs. Evening Star Pattern
Here’s a quick comparison for clarity:
|
Feature |
Morning Star Pattern |
Evening Star Pattern |
|
Trend Direction |
Signals bullish reversal |
Signals bearish reversal |
|
Candlestick Setup |
Bearish → Indecision → Bullish |
Bullish → Indecision → Bearish |
|
Occurs After |
Downtrend |
Uptrend |
Importance in Stock Market Classes
Stock market classes spend significant time teaching candlestick patterns, and the morning star pattern is usually high on the list. Understanding these patterns equips you with foundational analysis skills essential for both positional and intraday trading.
Optimal Trading Strategies Using the Morning Star
Seasoned traders don’t stop at identifying the pattern—they combine it with other tools, such as moving averages or RSI. Trading strategies often include:
-
Entering a trade after pattern confirmation with higher volume.
-
Using stop losses below the lowest point of the pattern.
-
Combining with support/resistance levels to improve reliability.
Common Mistakes to Avoid
-
Ignoring the overall trend: The pattern is less effective without a prior downtrend.
-
Overlooking volume: Watch for volume confirmation; without it, the pattern is weaker.
-
Jumping in before confirmation: Wait for the third candle to close.
Morning Star in Different Time Frames
This pattern is effective across various time frames. For long-term trades, use daily or weekly charts. For intraday traders, look for the pattern on shorter intervals, but remember, higher time frames tend to provide more reliable signals.
Integrating with Technical Indicators
Why just stop at candlesticks? Cross-verify with indicators like Moving Averages (MA), Relative Strength Index (RSI), or MACD for increased confidence. For example, if the RSI is showing 'oversold' conditions and the morning star appears, the bullish reversal becomes more convincing.
Morning Star Pattern in Indian Markets
The Indian stock market, being highly dynamic, often presents strong morning star candlestick pattern opportunities, especially during volatile periods or near major support zones. Traders in India frequently rely on this setup in Nifty and BankNifty indices.
Conclusion & Key Takeaways
The morning star candlestick pattern stands out as a simple yet powerful signal in technical analysis. It acts as a beacon, guiding traders toward possible market reversals and helping them make smarter, more informed decisions. Whether you’re self-learning or attending stock market classes, mastering this pattern adds a key skill to your trading toolkit.
FAQs
1. What does the morning star candlestick pattern indicate?
The pattern signals a potential reversal from a downtrend to an uptrend, suggesting a buying opportunity.
2. How reliable is the morning star pattern in trading?
When confirmed with other indicators and trading volumes, the pattern is considered highly reliable for spotting bullish reversals.
3. Can beginners use the morning star pattern effectively?
Absolutely! With proper guidance from stock market classes and practice on demo accounts, beginners can use this pattern efficiently.
4. Is the morning star pattern suitable for intraday trading?
Yes, when spotted on shorter time frames, the morning star can be used for intraday trades, but confirmations are recommended for accuracy.
5. What is the difference between the morning star and evening star patterns?
The morning star indicates a possible upward reversal after a downtrend, while the evening star signals a downward reversal after an uptrend.